
Image Source: http://www.carzi.com
So what does a straight line graph and a spectacular stunt jump have in common? Well we will land that one for you shortly.
We have all studies straight line graphs at school, and in later high school may have solved some simulataneous equations using graphs.
For example we have room in a theatre for 800 people, and we need to raise $2800 in ticket sales. The adult tickest are $4 each and child tickets are $2. How many adults and how many children do we need to have?

Image Source: http://image.wistatutor.com
Back to that amazing rally car jump by Ken Block.
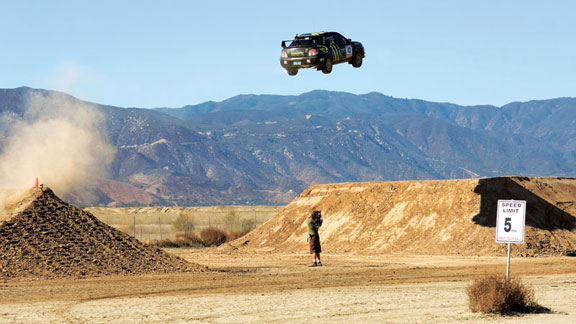
Image Source: http://a.espncdn.com
Let's take a look at a video of this amazing stunt.
When we do a big jump in a rally car or on a motor bike or mountain bike, we need some good spring suspension to be able to survive the landing.

Image Source: http://www.full-race.com
The behaviour of the springs used in suspension systems follows a straight line graph. Here is the type of mechanical set up that is used to measure the characteristics of suspension springs.
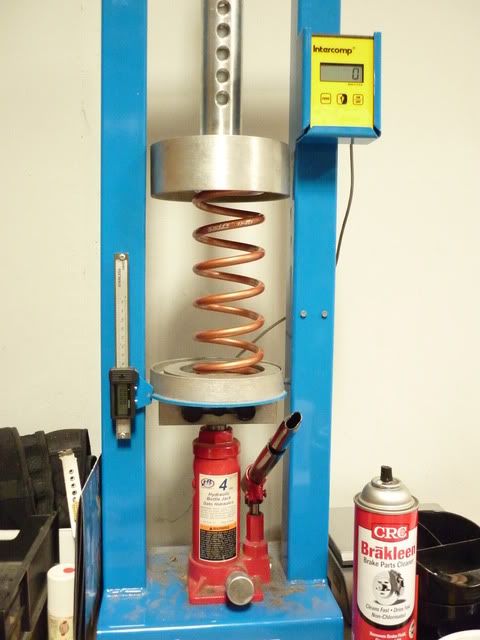
Image Source: http://i55.photobucket.com
And this is the type of straight line that results.
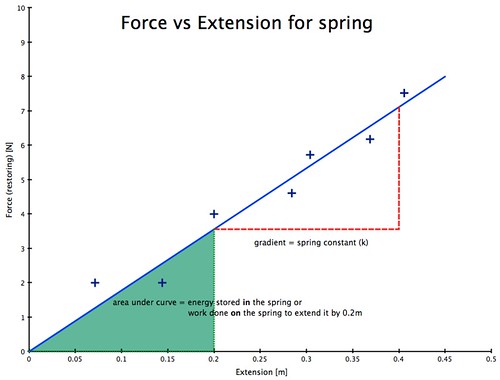
Image Source: http://farm3.static.flickr.com
We can then use the mathematical results to set up charts of the properties of different types of springs. Here for example is a chart showing the performance of various suspension springs that can be fitted to Land Rover four wheel drive vehicles.
Image Source: http://www.lrautomotive.com.au
Here are some graphs that analyse Mountain Bike suspension setups.
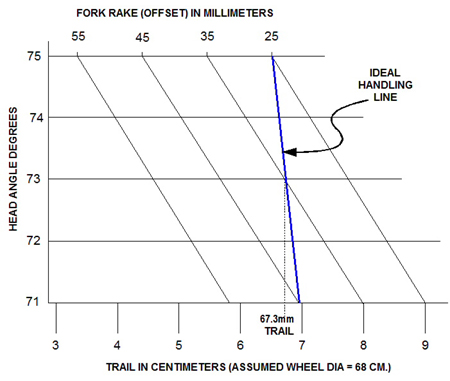
Image Source: http://davesbikeblog.squarespace.com
Graphs are also used to compare the running costs of vehicles.
Image Source: http://www.algebra-class.com
And are also used for other business applications involving money.

Image Source: http://www.filebuzz.com

Image Source: http://2.bp.blogspot.com
Line Graphs are also used in Engineering. Here is a graph of the fluid delivery by a pump.

Image Source: http://www.ledebuhr.net
Graphs are used for setting up exercise bikes to determine the amount of Power needed to be supplied by the rider.

Image Source: http://www.onetri.com
Line graphs are used extensively in statistics. For example in employment graphs.

Image Source: http://scienceblogs.com
Straight line graphs are used in science.

Image Source: http://staff.argyll.epsb.ca
Graphs are used extensively in Biology and Environmental studies.

Image Source: http://susty.com
Graphs are used in weather forecasting.
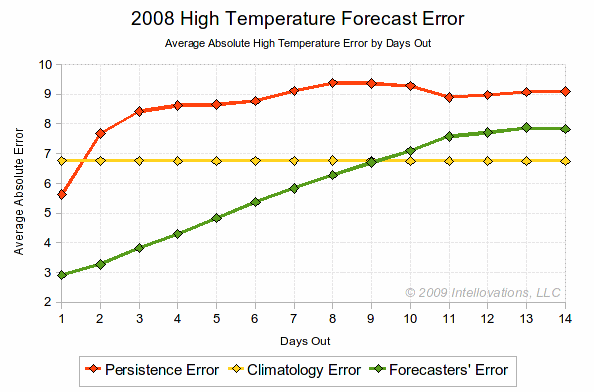
Image Source: http://www.forecastadvisor.com
Hair Color from lightest to darkest follows a straight line graph.

Image Source: http://1.bp.blogspot.com
Line graphs are used in analysing real estate sales.

Image Source: http://edynblog.files.wordpress.com
Various graphs are used for analysing internet usage patterns and statistics.
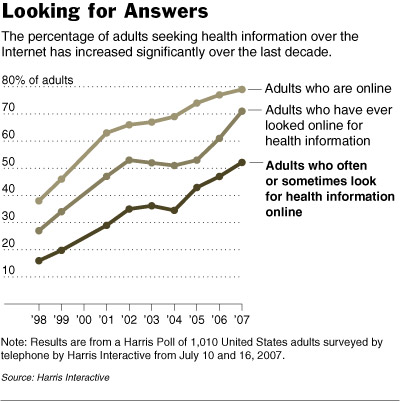
Image Source: http://media.artdiamondblog.com
Line graphs are also used to measure use of computers in various businesses.

Image Source: http://www.cdc.gov
Graphs are used in analysing medical health checks. This particular graph is for getting tested for sleep apnea problems.

Image Source: http://cpapandmore.files.wordpress.com
Linear Graphs are used for analysing medical drug usage.
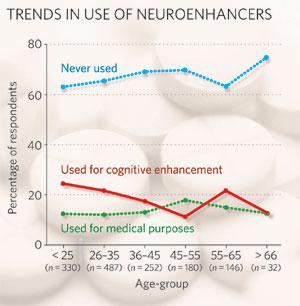
Image Source: http://www.nature.com
Linear Graphs are used to examine to cheapening cost of computer storage.

Image Source: http://www.storagesearch.com
So here's where we draw the line and say our the time on this one is completed.
There are many more uses of linear graphs that can be found. Simply use a Google Images query on "line graphs" to find many more.
Finally let's go back to Ken Block and his amazing rally driving, as in this episode of Top Gear. Now here is some real mathematical precision!
Enjoy,
Big Passy Wasasbi
No comments:
Post a Comment