Saturday, March 19, 2011

Real Venn Diagrams

Sorry Picture Not Found
Image Source: http://files.sharenator.com

Venn Diagrams are diagrams containing circles that show the logical relations between a collection of sets or groups.

They are used in many areas of life where we need to categorize or group items, as well as compare and contrast different items.

In this post we will take a look at several real world Venn Diagrams that we found using Google Images.

If a diagram is too small to see, then click on it to go full size. You may then have to use the browser back button to return to this page.

As our first example, the following Venn Diagram compares the features on different models of PlayStation 3 gaming consoles.

Sorry Picture Not Found
Image Source: http://www.wired.com

In the following diagram a scientist is using a Venn Diagram to show the setup of a Biospheres experiment.

Sorry Picture Not Found
Image Source: http://blogs.saschina.org

Venn diagrams are Used in Biology to compare different Animals.

Sorry Picture Not Found
Image Source: http://www.learnnc.org

Another Biological Venn Diagram is this one.

Sorry Picture Not Found
Image Source: http://k-8visual.info

Here is a Venn Diagram that classifies Fish into different biological groupings.

Sorry Picture Not Found
Image Source: http://3.bp.blogspot.com


This next Venn Diagram compares Tigers and Bison.

Sorry Picture Not Found
Image Source: http://wc1.smartdraw.com

Microsoft Excel even has an extension pack which Biologists use.
The following shows a comparison of Humans, Gorillas and Bonobos done in Excel.

Sorry Picture Not Found
Image Source: http://farm5.static.flickr.com


All sorts of things can be analysed with Venn Digarams:

Sorry Picture Not Found
Image Source: http://skew.dailyskew.com

Venn Diagrams are used in Language to make detailed analysis and comparisons.

The following Venn Diagram shows types of English words that are different in spelling and meanings.


Sorry Picture Not Found
Image Source: http://images-mediawiki-sites.thefullwiki.org

Diagrams can also be used when studying literature to compare the content of novels.

Sorry Picture Not Found
Image Source: http://www.michiganopera.org

Venn Diagrams can also be used to compare characters in a novel.

Sorry Picture Not Found
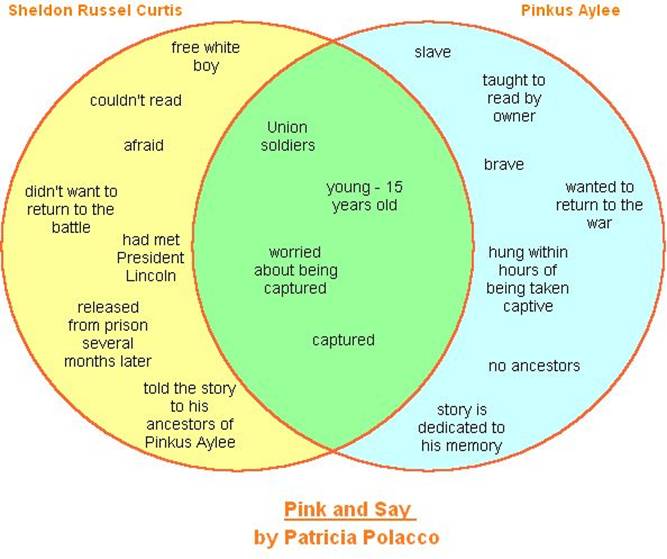
Image Source: http://users.manchester.edu

They can also be used to critique the works of all the Authors a person has been reading.

Sorry Picture Not Found
Image Source: http://brandon.pulpexplosion.com


Venn Diagrams can be used to show the relationships in complex organizations such as the European Economic Union.

Sorry Picture Not Found
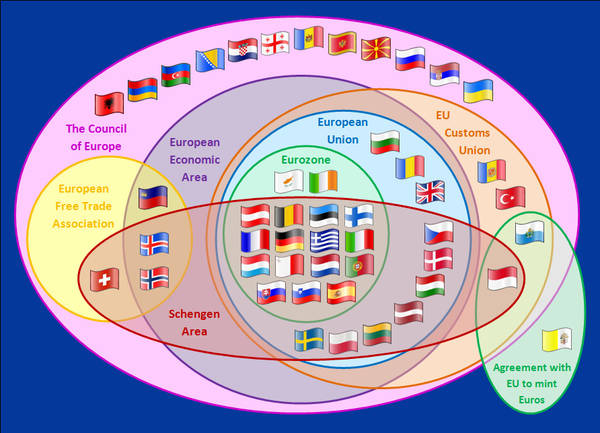
Image Source: http://craphound.com


Diagrams can also be used in Geography to explain how nation groups and states belong to each other. (Click on this image to make it fully visible).

Sorry Picture Not Found
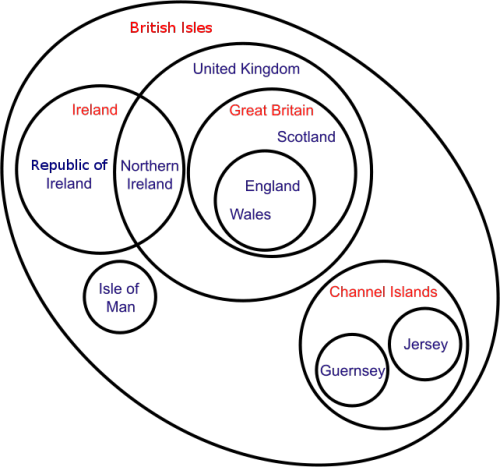
Image Source: http://28.media.tumblr.com


Here is a diagram which shows the relationships between the Sciences.

Sorry Picture Not Found
Image Source: http://farm4.static.flickr.com

Venn diagrams can be used to list all the issues associated with environmental and economic concerns.

Sorry Picture Not Found
Image Source: http://wc1.smartdraw.com

Venn Diagrams are used in Psychology.

Sorry Picture Not Found
Image Source: http://1.bp.blogspot.com

Venn Diagrams can be used to show the changing nature of work in our world.

Sorry Picture Not Found
Image Source: http://www.discover.tased.edu.au

Diagrams can also be used by Human Resource Managers and Careers Advisors to show the characteristics of different jobs.

Sorry Picture Not Found
Image Source: http://4.bp.blogspot.com

Venn Diagrams can be used for analysing the effectiveness of websites.

Sorry Picture Not Found
Image Source: http://www.insidehighered.com

Venn Diagrams are used in Psychology and Wellbeing.
The following diagram represents "The Four Areas Of A Thriving Life"

Sorry Picture Not Found
Image Source: http://thriveology.com

Venn Diagrams are used by Scientists studying human health and medicines.
The following diagram is all about "Amino Acids" which are essential to human life.

Sorry Picture Not Found
Image Source: http://www.dsimb.inserm.fr

Venn Diagrams are used in Politics to describe types of government systems.

Sorry Picture Not Found
Image Source: http://www.education.ne.gov

Venn Diagrams are used by Geologists and Mining Engineers for mineral exploration.

Sorry Picture Not Found
Image Source: http://www.auzex.com

Venn Diagrams can be used to analyse Religions.
(Click on this image to make it fully visible).

Sorry Picture Not Found
Image Source: http://www.pps.k12.or.us

Venn Diagrams are used a lot in modern Marketing Analysis.

Sorry Picture Not Found
Image Source: http://farm3.static.flickr.com

Venn Diagrams are used in Mathematics to divide all possible number types into groups.

Sorry Picture Not Found
Image Source: http://thinkzone.wlonk.com

They are also used in Mathematics to see what groups of numbers have things in common.

Sorry Picture Not Found
Image Source: http://www.helpingwithmath.com

Venn Diagrams can even be used to analyse music.

Sorry Picture Not Found
Image Source: http://www.dailyfunnystuff.net

We can analyse the characters in TV shows like "The Muppets" with a Venn Diagram.

Sorry Picture Not Found
Image Source: http://2.bp.blogspot.com


Some people even use Venn Diagrams to make jokes about Venn Diagrams.

Sorry Picture Not Found
Image Source: http://2.bp.blogspot.com

And some people just make funny Venn Diagrams for humorous purposes.

Sorry Picture Not Found
Image Source: http://15.media.tumblr.com

The following Venn diagram was made by someone who has obviously used a lot of Public Toilets.

Sorry Picture Not Found
Image Source: http://30.media.tumblr.com

The following diagram summarizes my own experiences of Airline seating perfectly.

Sorry Picture Not Found
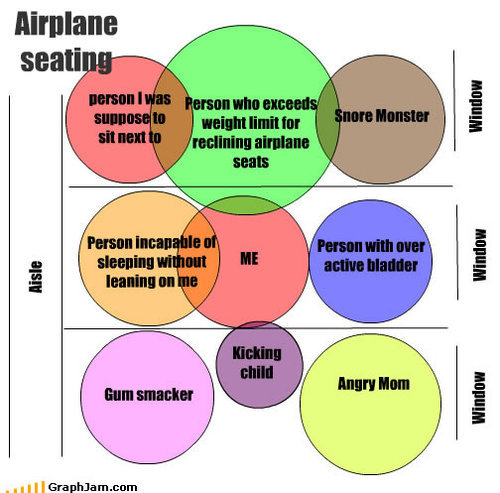
Image Source: http://25.media.tumblr.com

Anyway, I've got to fly off and do a few things.

Enjoy,
Big Passy Wasabi

Friday, March 18, 2011

Camping Friday Funny

Sorry Picture Not Found
Image Source: http://www.myspaceantics.com

Big Passy is off on school camp with the children next week, and he is hoping for good weather. So next week there will not be a Friday Funny.

Hopefully there won't be any disasters like the ones in this video.


And the children will be sound asleep early every night.

Sorry Picture Not Found
Image Source: http://icanhascheezburger.files.wordpress.com

Here is another great promotional video about camping, (but be warned, the song does have some rude words in it here and there).


Here is a real camping disaster in the making for one of our woody little friends.

Sorry Picture Not Found
Image Source: http://farm1.static.flickr.com

If sleeping in a tent looks far too daunting for you, then maybe caravaning is the answer. Just be careful that you have the right setup on your rig.


Not too sure whether this guy was trying to impersonate a bear attacking a tent, or whether he had been drinking too much from a bottle with a big white bear on its label.


If you are scared of spiders, then camping may not be for you.


And here in Australia, snakes can be a bit of a worry for all campers.

Sorry Picture Not Found
Image Source: http://heysko.com

Speaking of snakes, here is another great camping prank from those great Aussie "Gall Boys".


In online war games, if you just hide somewhere and try and shoot passers by, this is known as "Camping". Other players do not like you doing this, because you should be playing fair and running around and getting shot at like everyone else. Camping is basically a noob cowardly act.

Here is a musical parody about this type of "camping". It is a little bit on the long side, and you probably need to be an online gamer to get the humor.


Here is a great Camping Fail Video that shows what war game camping is all about. You find a good hiding spot and you lay down in the prone position so it is really hard for anyone to shoot you. This is classic camping, but watch what happens.


Anyway, I'm off to stock up on some quality weekend sleep before all the fun of school camp.

Enjoy,
Big Passy Wasabi

Tuesday, March 15, 2011

Tsunami Mathematics

Tropical Tsunami
Image Source: http://millicentandcarlafran.files.wordpress.com

During 2011, most of us viewed news reports of powerful and devastating Tsunami waves that were produced by a 9.0 magnitude Earthquake
off the shore of Japan.

A Tsunami is actually a series of waves. In the open ocean the waves are not high at all, and can pass under ships with no noticeable effect.

But Tsnamis can travel at the speed of jet aircraft (700 km/hr), and can stretch in length for hundreds of kilometres across the ocean.


As the waves approach land, their energy intensifies, and the height of the wave can increase to as high as 60 meters.


Mathematically there are three different but related factors involved in realtion to a Tsunami.

These are SPEED, HEIGHT, and ENERGY POWER.

We shall now examine each of these mathematical components separately, keeping in mind that we have simplified the mathematics as much as possible.

Detailed mathematical equations of water waves look something like this:

Sorry Picture Not Found
Image Source: http://www.oceanographers.net

These equations require super computers to help work on them.

To see what the full set of real equations look like, as well as a computer model of a Tsunami, check out the following web page:

http://mathworld.wolfram.com/news/2005-01-14/tsunamis/

We have simplified the mathematics greatly in the material which follows.


Let's start with Tsunami speed.

Mathematical Speed of a Tsunami

In the open Ocean the speed of a Tsunami is approximately:

  • Speed = The Square root of (9.8 x Water Depth)

The 9.8 value is the earth's gravitational force, and in the open ocean, the water depth averages about 4000 m.


Sorry Picture Not Found
Image Source: http://2.bp.blogspot.com

Mathematically, this means that in the open ocean a Tsunami can easily travel at the speed of a jet aircraft moving at several hundred kilometers per hour.

(Source: http://terrytao.wordpress.com/2011/03/13/the-shallow-water-wave-equation-and-tsunami-propagation/)

However, when the Tsunami approaches close to a shoreline, and the depth decreases to a few hundred meters, the speed slows down, (as per the above maths equation), to a few hundred km / hr.

As the Tsunami waves slow down, they move closer together and rise in height. They can reach heights up to 60 metres when they arrive on shore, with speeds of 250 km/hr, producing a huge destructive force.


Mathematical Height of Tsunami Waves

As the Tsunami approaches shore, the water depth decreases, causing the Tsunami to slow down, at a rate proportional to the square root of the depth.

Unfortunately, "wave shoaling" then forces the Amplitude (Height) to increase at the opposite rate of:

  • Height is proportional to 1 divided by square root of water depth.

Eg. If the water depth is 400m and then decreases to 4m, then we have a 1/20 Amplitude rising to a 1/2 Amplitude, which means the wave will suddenly become 10 times higher. So a 1m high wave one km from the shoreline, suddenly becomes 10 metres high as it gets to the shoreline.


The following diagram shows this Mathematics of the Tsunami height increasing:

Sorry Picture Not Found
Image Source: http://www.cnsm.csulb.edu

The following picture shows a 10 meter high Tsunami hitting the coast of Japan.

Sorry Picture Not Found
Image Source: http://www2.registerguard.com


Mathematical Power of Tsunamis

The POWER of any wave is mathematically related to the square root of how LONG the wave is.

  • Energy Power is proportional to the square root of wave Length.

(Source: http://plus.maths.org/content/os/issue34/features/tsunami/index)

Normal waves at a beach on a rough day might look something like this:

Sorry Picture Not Found
Image Source: http://cdnimages.magicseaweed.com

Long Waves at an Ocean beach produce much more powerful "surf" waves, because they have much more side to side length:

Sorry Picture Not Found
Image Source: http://cdnimages.magicseaweed.com

In Victoria Australia, beaches with Long waves that are very powerful include: Kilcunda, Woolamai, Venus Bay, and to a much lesser extent Inverloch.

It is important to realise that if a wave doubles its left to right Length, then its power will increase by a factor of the square root of 2 or around 41%.

So the increase in Power is not double when we double the length, but is around 1 and a half times more powerful.

Tsuanamis are waves that are hundreds of kilometers long, and so the energy power they unleash is thousands of times greater than that of even the biggest crushing surf or storm waves.

And how did these Tsunami waves become so long?

Well we need to remember that the earthquake that produced them unleashed a mammoth amount of energy into the ocean. And this energy produces waves which are hundreds of kilometres long. Waves that are much longer than the winds from any big storm could ever produce.

Sorry Picture Not Found
Image Source: http://www.washingtonpost.com


The following video shows the long Tsumani waves hitting Japan in March 2011.


This next video that shows the power of these huge Tsunami waves as they hit the shore of Japan in 2011.


As can be seen, the Tsunami is more like a huge surge of water, rather than one big crashing wave. Also evident in these videos is that there are several Tsunami waves coming one after each other. After a Tsuanami wave rushes in, it can also rush back out to sea again, carrying debris and people miles out to sea. In addition, it is quite possible for more giant waves to keep arriving, even an hour after the first one has hit.

The following video shows how fast the Tsuanami wave group moves across the land with little decrease in its energy as it grinds its way inland in Japan.


In this next video the Tsunami overcomes the protective sea wall that had been built around a Japanese town:


So that's a bit of simplified Mathematics about the massively damaging power of Tsunamis. Hopefully it adds to our understanding of the world around us, even if it is only useful the next time we happen to visit a surf beach. Let's hope none of us ever do any first hand investigation of the mathematics of a Tsunami wave.

Enjoy,
Big Passy Wasabi

Monday, March 14, 2011

Build a Website Tutorials

Pic of Robbies Webpage

In this blog post we have a series of videos on how to create a website using Dreamweaver CS3.

We made these videos here at Passy World using Techsmith Camtasia 7.1.

These videos are all "HD" fullscreen, and so be sure to use the bottom right hand option in the YouTube player to load each video as HD and watch it in full screen mode.

Also note that whenever we mention pressing the "Return" key, this is the same as pressing the "Enter" key. (Eg. In Dreamweaver, pressing the "Enter" key makes a carriage return to take us to a new line).

Our set of YouTube videos cover the following:

  • Intro to "Robbie's Outdoor Services" Website
  • Defining the Site
  • Making a Template
  • Making Rollover Buttons
  • Adding the Buttons to the template
  • Making the Home Page
  • Making a Prices page
  • Making a Booking Form page.

So let's get started,

This first video is the introduction for the series of video tutorials where we build a website using Adobe Dreamweaver CS3 for "Robbie's Outdoor Services".


In the following tutorial video we define the site for "Robbie's Outdoor Services" in Dreamweaver CS3. We also set up the Windows folders we need for storing our website components. Finally we put our Google Images and blank button image into these folders.


In the next tutorial we use Adobe CS3 Fireworks to make light and dark images of Buttons that we are going to use for our "Robbie's Outdoor Services" website. The twelve buttons we make are (2 of each, a light green and a dark green), for each of Home, Services, Prices, Bookings, Associates, and Contact.


The following video shows how to use Layout Tables and Cells in Dreamweaver CS3 when building a template for a website.


Now that we have made images for our Rollover buttons, and a template for our site, we are now ready to create the "Rollover Buttons".

The following video shows how to add in Rollover Buttons using Adobe Dreamweaver CS3 when building a template for a website. (Make sure you have first watched the previous video on how we made the images of the rollover buttons using Adobe Fireworks).


Now that we have rollover buttons on the template, we are ready to build our first page, which is the "Index" or "Home" page.

In the tutorial video below, we use the template we have made to build the Home page for "Robbie's Outdoor Services". We then link this new "Index.html" page to the Home button that is on our .dwt Template.


In the next video we build the next page in our Website. This webpage, (built from our existing template), is the "Prices" page for our "Robbie's Outdoor Services" website by using Dreamweaver Tables.


This next video shows how to use Forms in Dreamweaver CS3 when building a "Bookings Page" website. The Bookings page is built incorporating a template we built for our website in a previous tutorial.


This final video is part 2 of our tutorials that show how to use Forms in Dreamweaver CS3 when building a "Bookings Page" on a website.


Note that in the Part 2 video, we have not shown the final step of editing the .dwt template, and linking its "Bookings" button, to our Bookings webpage HTML.

The inspiration for making this set of videos came from doing Greg Bowden's "Guided Computer Tutorials" in Dreamweaver CS3. If you would like to buy great training materials from Greg, then check out his website by clicking the link below:

http://www.gct.com.au/

We hope this set of Video Tutorials are of use to all people who are interested in building websites with Adobe Dreamweaver.

Enjoy,
Big Passy Wasabi

Thursday, March 10, 2011

Graphs Friday Funny

Sorry Picture Not Found
Image Source: Graphjam.com

GraphJam is an excellent website where people make graphs for fun. The idea is to have a laugh at popular culture, music, and movies.

There is even opportunity for people to make their own graphs and submit them to the site.

However, GraphJam is not always a G-Rated "family-friendly site". If you visit their site, you may find some graphs which are not quite politically correct.

The following selection contains some of our favourite graphs, which we mostly obtained links to from the Australian website:
http://www.inmycommunity.com.au/

rather than from GraphJam itself.

There are quite a few graphs, so depending on your internet connection speed, they may take a while to fully load onto this page.

Sorry Picture Not Found
Image Source: Graphjam.com


Sorry Picture Not Found
Image Source: Graphjam.com


Sorry Picture Not Found
Image Source: Graphjam.com


Sorry Picture Not Found
Image Source: Graphjam.com


Sorry Picture Not Found
Image Source: Graphjam.com


Sorry Picture Not Found
Image Source: Graphjam.com


Sorry Picture Not Found
Image Source: Graphjam.com


Sorry Picture Not Found
Image Source: Graphjam.com


Sorry Picture Not Found
Image Source: Graphjam.com


Sorry Picture Not Found
Image Source: Graphjam.com


Sorry Picture Not Found
Image Source: Graphjam.com


Sorry Picture Not Found
Image Source: Graphjam.com


Sorry Picture Not Found
Image Source: Graphjam.com


Sorry Picture Not Found
Image Source: Graphjam.com


Sorry Picture Not Found
Image Source: Graphjam.com


Sorry Picture Not Found
Image Source: Graphjam.com


Sorry Picture Not Found
Image Source: Graphjam.com


Sorry Picture Not Found
Image Source: Graphjam.com


Sorry Picture Not Found
Image Source: Graphjam.com


Sorry Picture Not Found
Image Source: Graphjam.com


Sorry Picture Not Found
Image Source: Graphjam.com

To find more hilarious graphs about all sorts of everyday things, from the Mundane to the Insane, check out the GraphJam site at the following link:
http://graphjam.memebase.com/


Enjoy,
Big Passy Wasabi